When I was working at UQx one of the big buzzwords was ‘active learning’. When polled, 78% of lecturers said their courses involved active learning. However, only 43% of students agreed.
The Institute for Teaching and Learning Innovation wanted a way to quantify the active learning occurring at UQ. This project aimed to monitor the sound in UQ classrooms and automatically determine whether they were being used for active learning or not.
At the time, I failed to meet this objective. I was at the end of first year and had a serious lack of signal processing skills. A year and a half later, I return to the problem with much greater success.
Based on the given objectives, I decided to break down the types of classroom activity into three groups:
- no activity (no one speaking)
- traditional lecture (one person speaking)
- tutorial/practical/collaborative learning (many people speaking)
Rather than trying to analyse the entire 50 minutes of audio at once, I break it down into 30 second segments. I then classify each of the segments into one of the three categories. Next I look at the relative occurrence of each category, and use this to decide on a final overall classification.This has two advantages:
-
The processing is more robust. If there are sections with odd noises or unrepresentative activity, they only effect a small part of the classification, and don’t change the end result.
-
It is more applicable to real time processing. The end goal is to have an IoT network of these devices that can monitor rooms in real time. This breakdown method means the device can report preliminary results every 30 seconds.
The Breakdown
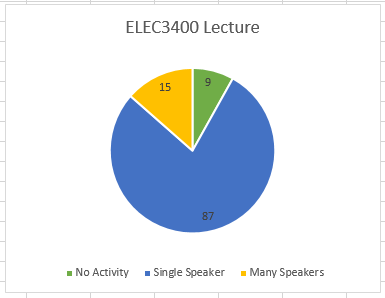
Each recording gets broken down into the 30 second segments. After processing, the result is a timeline of classifications over the length of the recording. Below is an example timeline from a lecture.

The percentage breakdown is used to determine which activity was occurring over the duration of the recording. Sometimes this is easy (if every segment has the same activity) however this never happens in practice. For example, in most practicals there is a fair amount of instruction from the instructor (which sounds like a lecture) before the class starts talking (which sounds like a prac). Or lecturers can take breaks, class can finish early, etc.

The solution to this is to have a percentage threshold for each activity. While the range of recording data I have is limited (all of the recordings come from engineering classes) this breakdown generates the best overall classification so far:
- Traditional lecture: single speaker >60% of segments
- Active learning: many speakers >40% of segments
- No activity: no speakers >50% of segments
Once these breakdowns are tuned with more data from across faculties, the problem then becomes classifying each segment of audio.
Classifying Segments
This is where I had particular difficulty in 2014, and have recently had more success (this new paper in particular helped a lot - they’re trying to achieve something similar, counting the number of people with audio for efficient use of HVAC). Processing was completed in MATLAB primarily using the Signal Processing Toolbox.

As it turns out, since we have ~100 segments per class, and fairly generous thresholds, we don’t actually have to classify each segment perfectly to achieve excellent accuracy overall. In fact, even with the best algorithms there is likely to be some confusion when unusual activities occur (for example applause can throw the algorithms off). As such, breaking into more, shorter segments is advantageous.
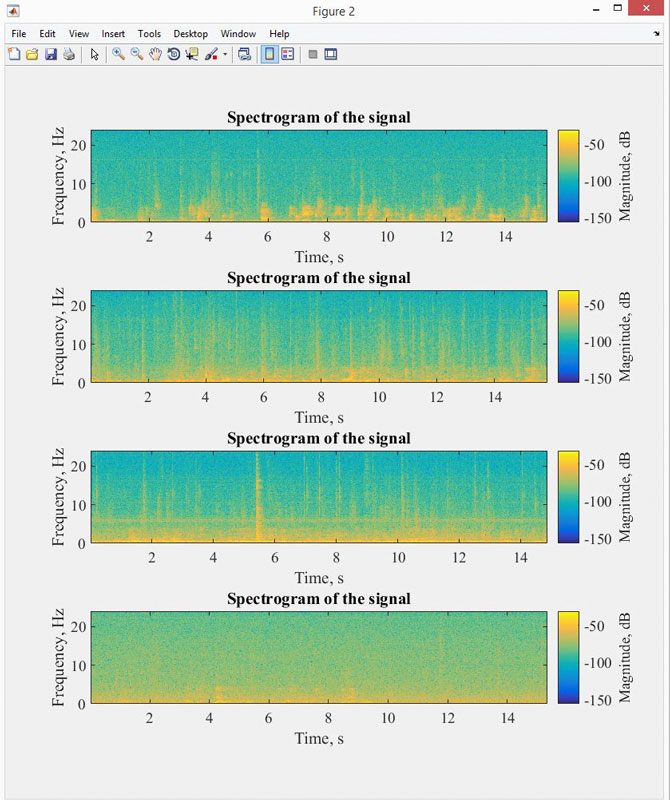
The first step when classifying a segment is determining whether there is activity or no activity. I use a combination of the signal’s average magnitude, the autocorrelation, and the zero crossing rate, a classic voice detection approach.
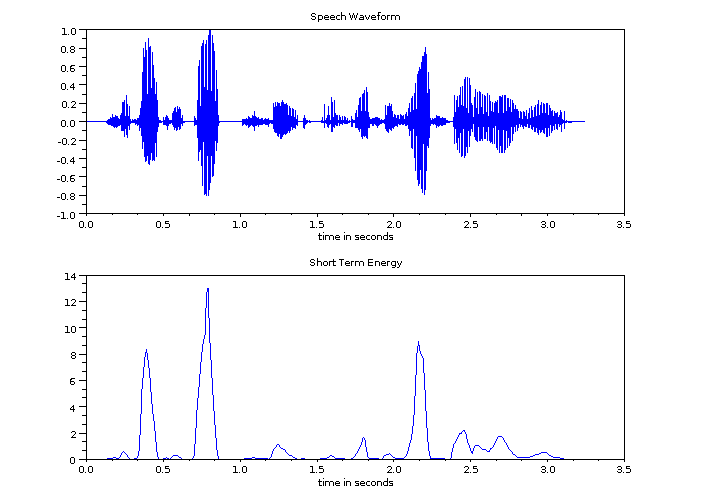
If there is activity, I then look at the distribution of short term energy of the signal. Short term energy is a clear indicator of speech. See the figure below for a comparison of speech waveform and short term energy.

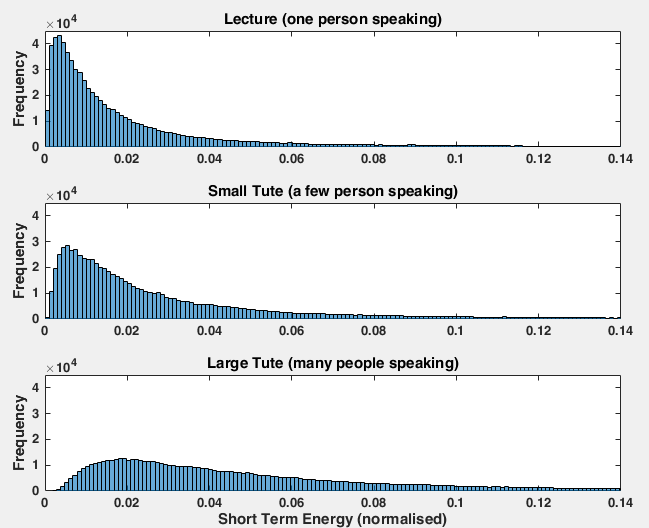
When a single person is speaking, there are large spaces in the signal between words, which means a lot of the time the energy is low. This creates a fairly pointy distribution of energy over each segment. When more people are speaking, the level of speech starts to become more constant, resulting in a distribution with far lower kurtosis. The figure below shows the distribution of short term energy across three segments: a lecturer speaking, a small (<10) group of students talking, and a large (>20) class of students talking in a tute.

The paper I linked above fitted a curve to this distribution and used the resulting probability density function to estimate the number of people in the room. From my analysis to date, my opinion is that this would give a ballpark estimate, but would need fine tuning for each room it is employed in. However, by looking at the mode of the distribution it is fairly simple to find a threshold that accurately separates a single voice from a group of voices.
When all of this is combined and automated I believe it is a good solution to the problem. In order to truly test the robustness of the algorithms I need a lot more data across a wider range of scenarios. This is fairly easy to obtain, it simply requires collaboration with a team across faculties. And likely another round of ethics approval. The algorithms could then be loaded onto embedded devices that sit in classrooms and automatically classify the activity.
While the purpose of this test was limited in scope, it is not hard to see how this technology could be employed more broadly. In fact, with the proliferation of IoT, it would not be surprising if universities soon employ activity measurement devices in all rooms. At growing institutions such as UQ, efficient utilisation of teaching spaces is critical. Currently UQ sends around staff with clickers to determine whether actual use reflects the booking of spaces. With networked microphones in every classroom, universities could soon see usage in real time and automatically detect under-utilised spaces.